My name is Simon and I enjoy designing interactions. I strive for meaningful, appropriate and accessible presentation of content.
Find me at JetBrains working as UX/UI Engineer. I like to work with humans, paper, Sketch and web technology. See some projects below and drop me a line!
A robot composing poems
A chart recorder
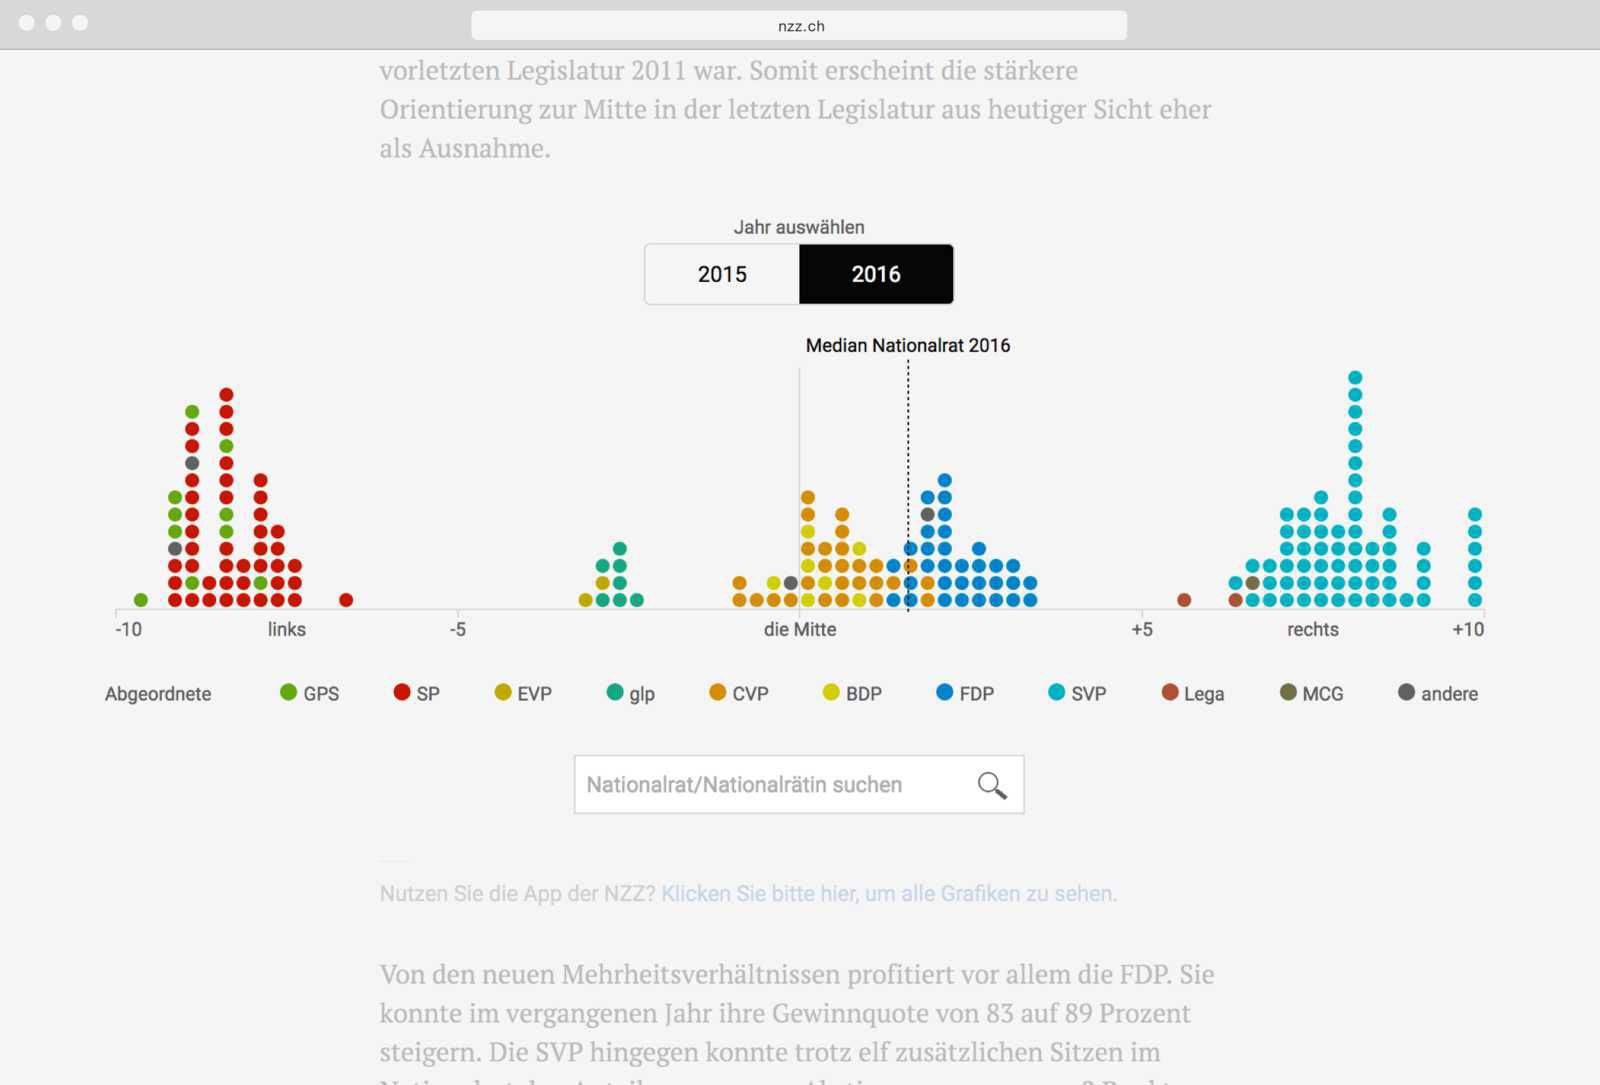
Rating members of the Swiss Parliament
Once a year the NZZ rates all members of swiss parliament based on their voting behavior on a left/right scale. A dot plot maps the distribution of their votes.
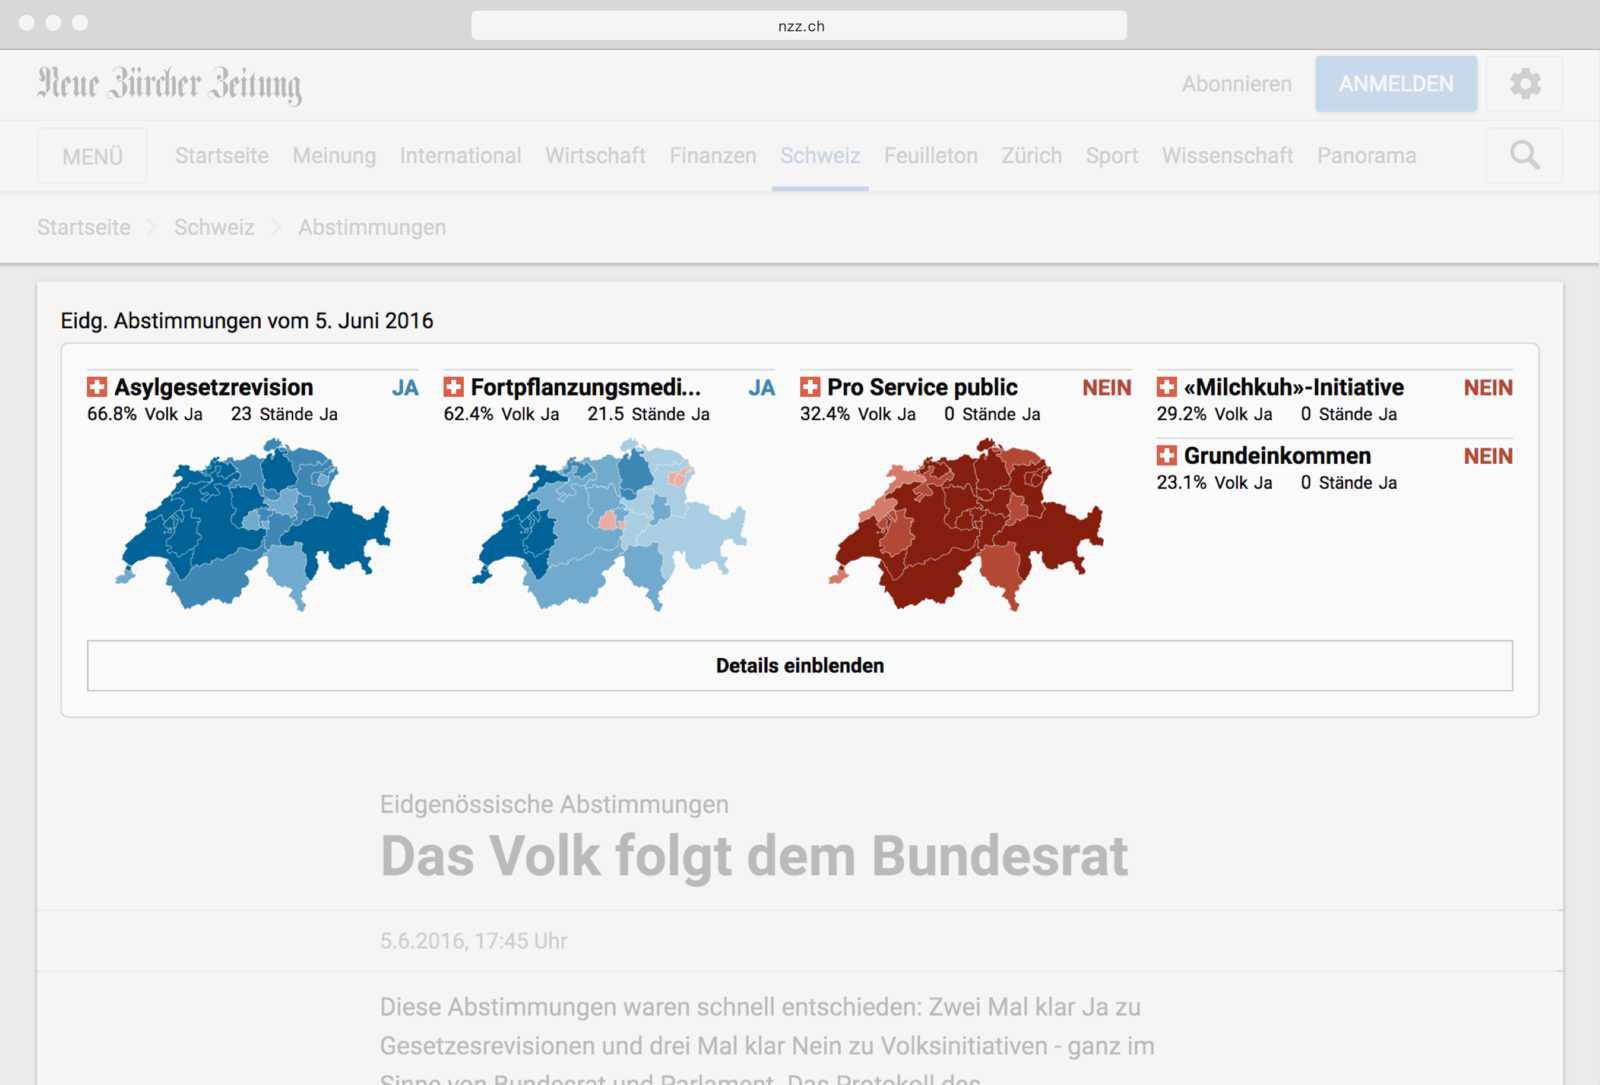
Visualizing pollings
Four times a year is polling day in Switzerland. A responsive visualization shows the most recent data for national and regional pollings in an intuitive accessible way.
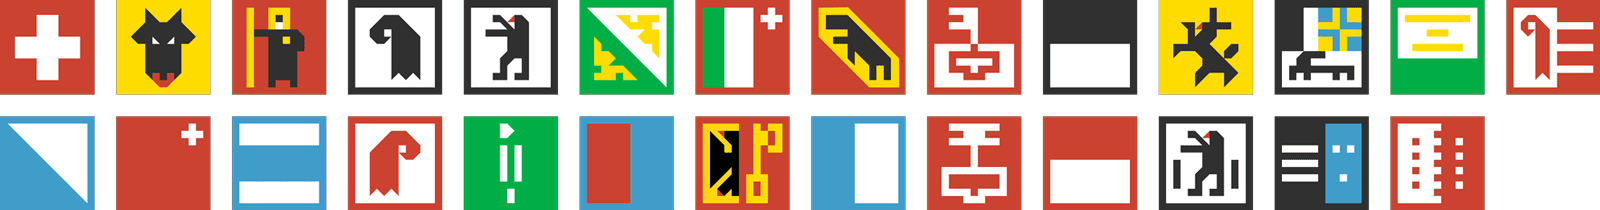
Swiss canton icons
I designed icons for all 26 swiss cantons. They are used within the polling day visualization to improve readability of lists. Contribute on Github.
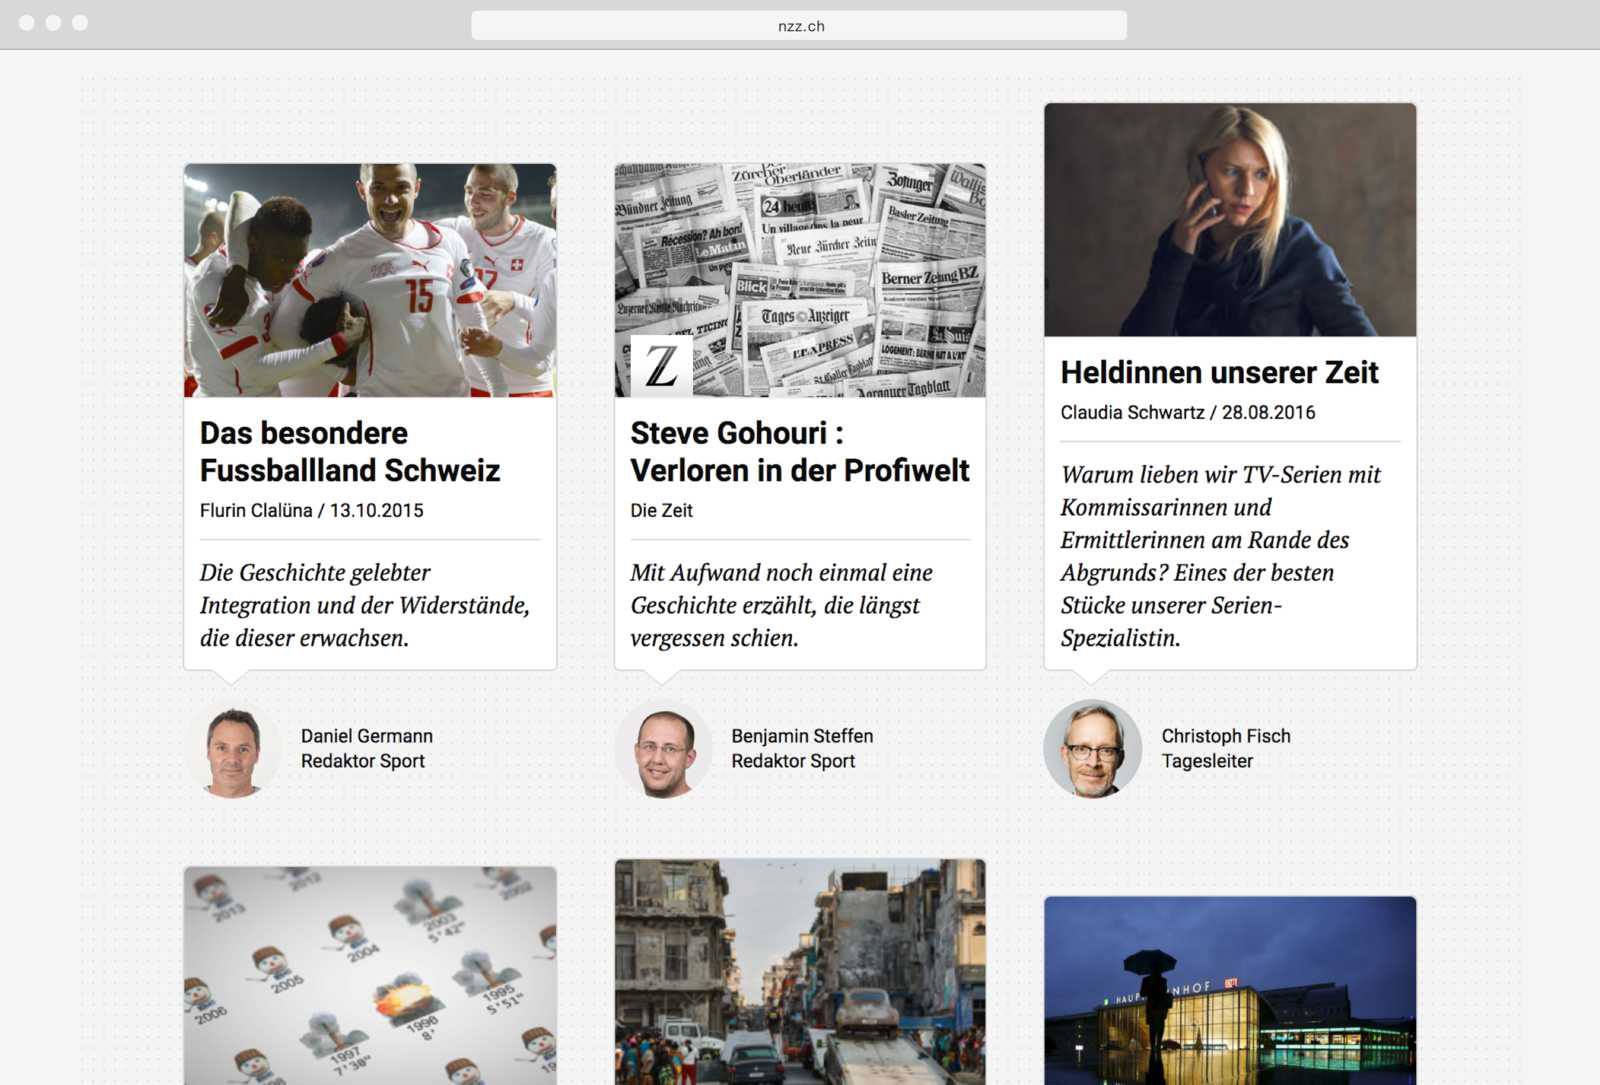
Looking back
A huge number of articles get published on nzz.ch and other media year by year. The vast majority vanishes after a short period of time. Journalists could pick some of their 2016 favorites to bring them back.